Industry Benchmark Reports
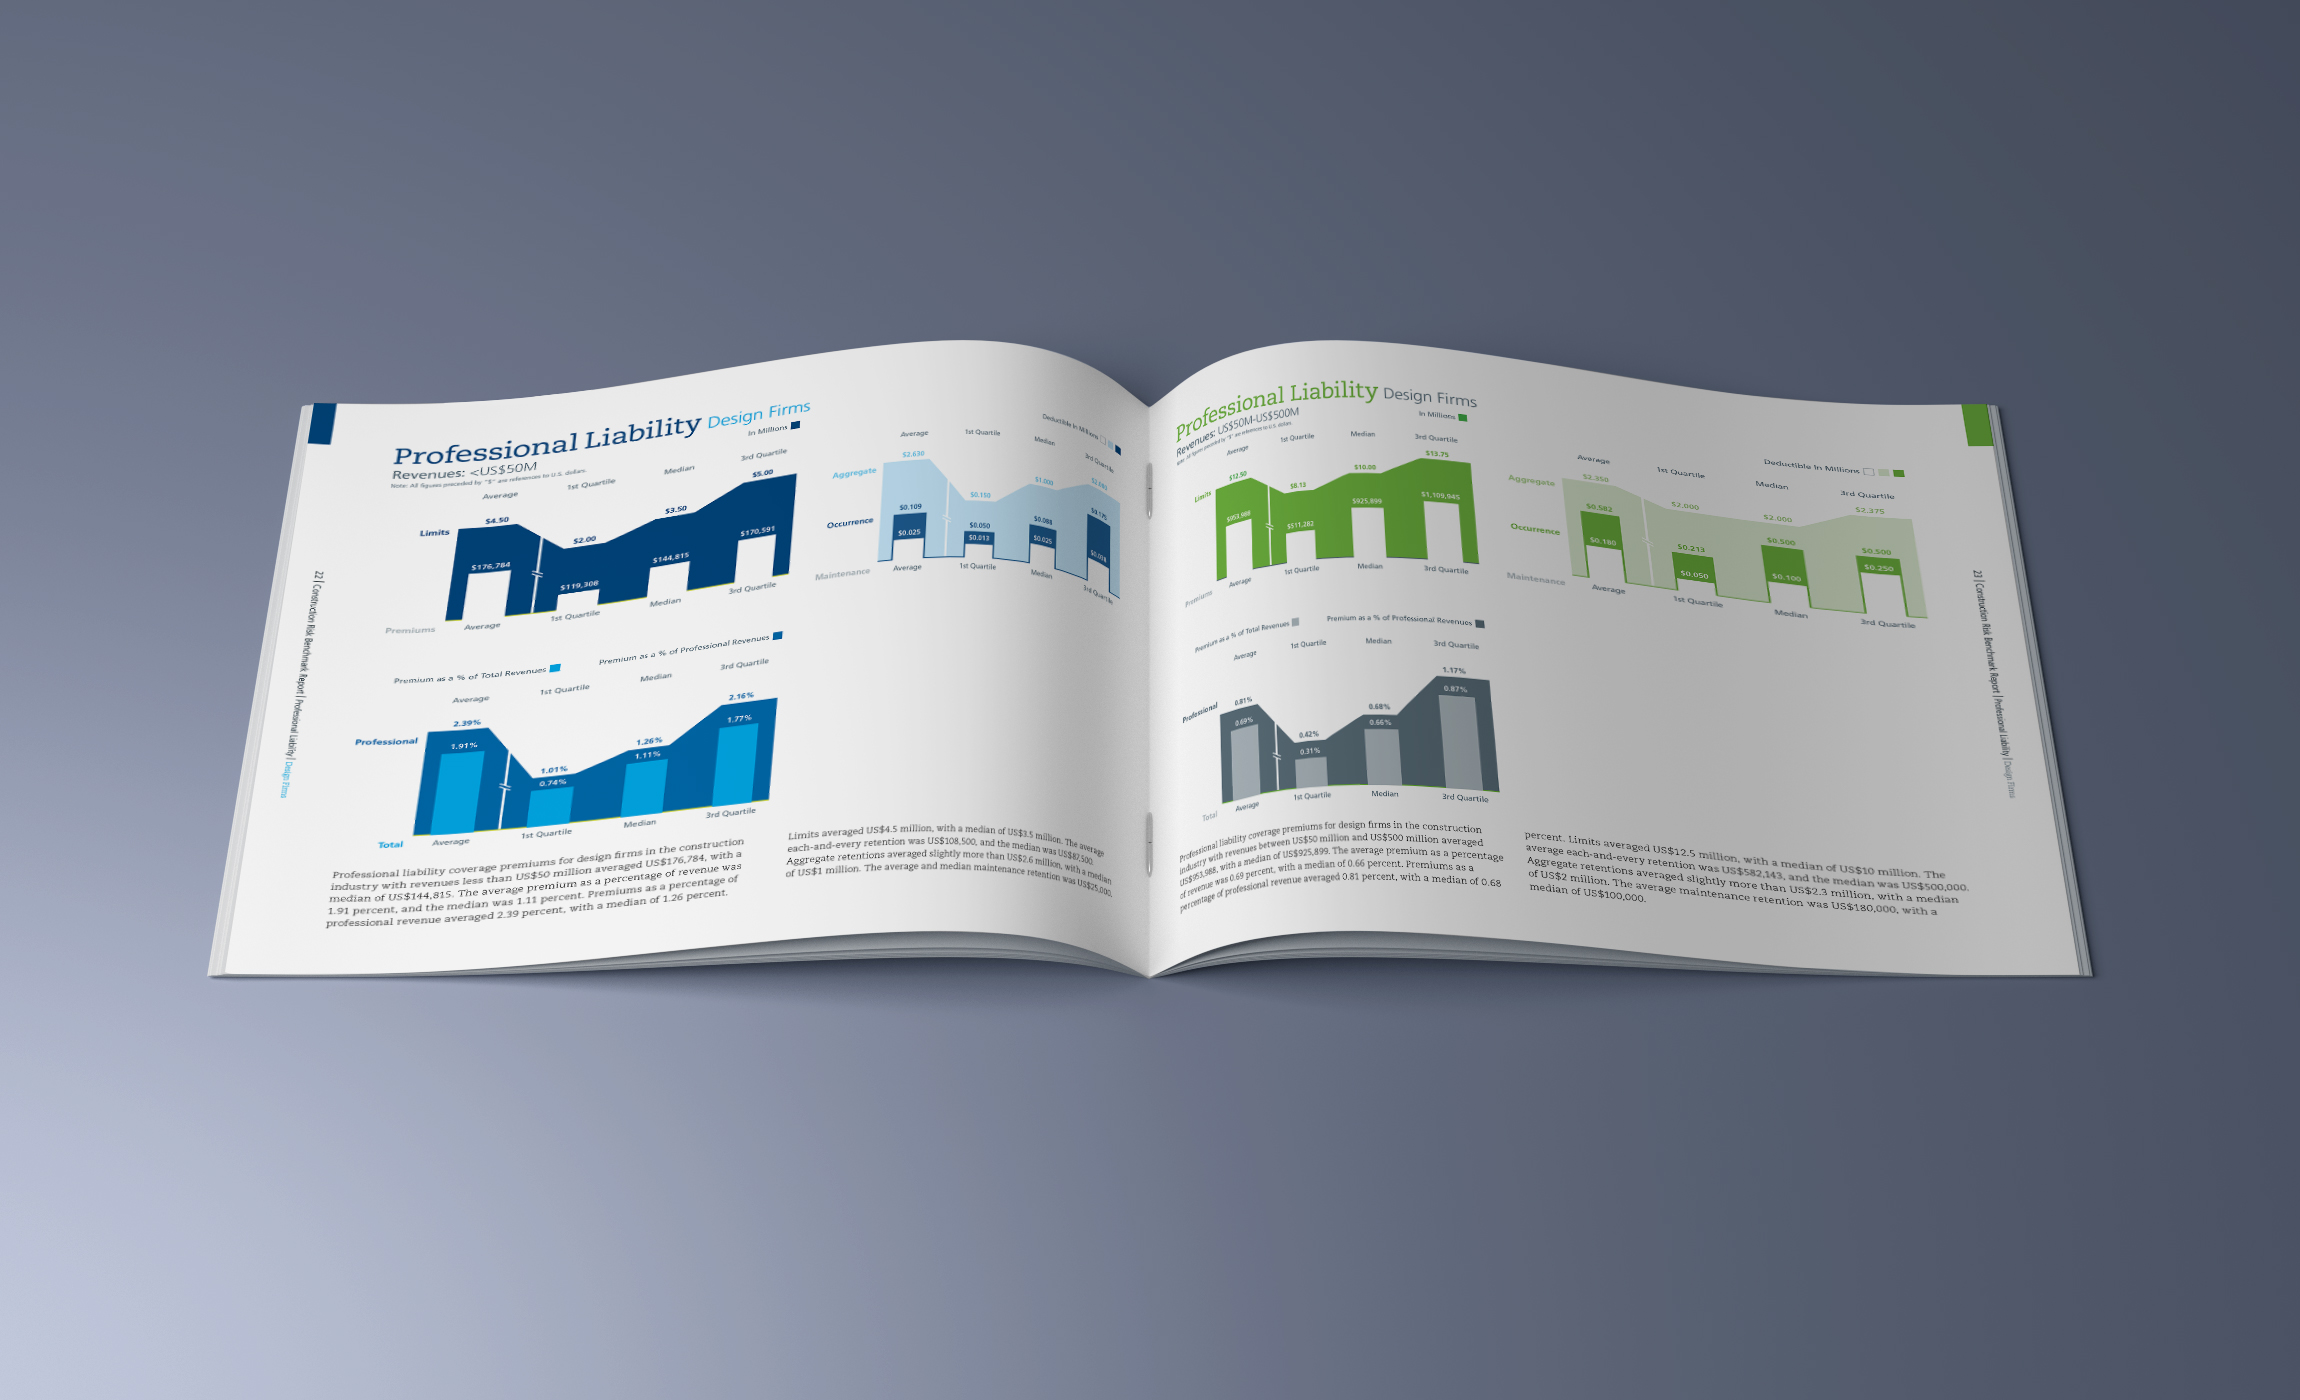
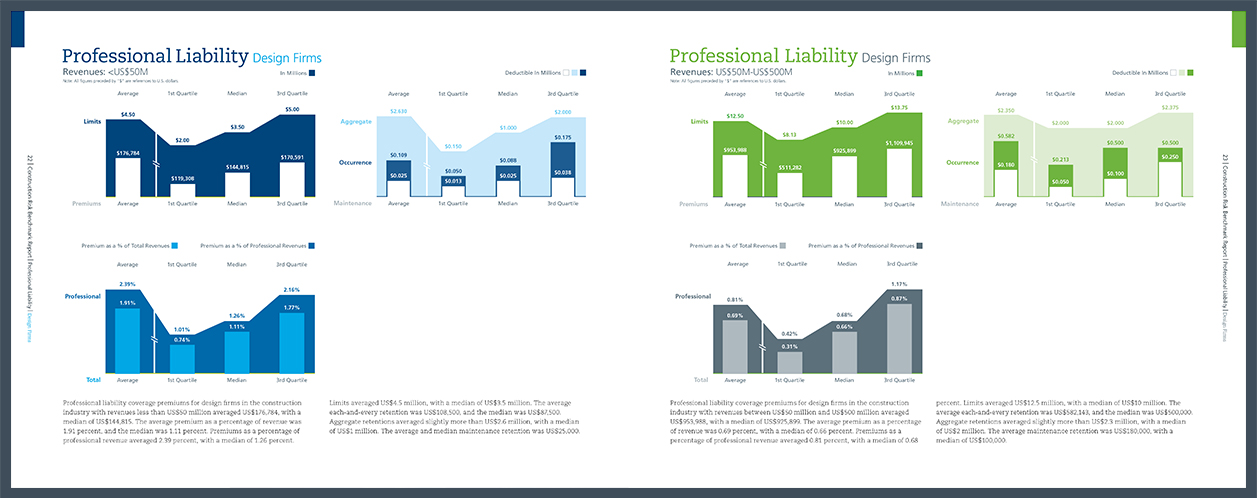
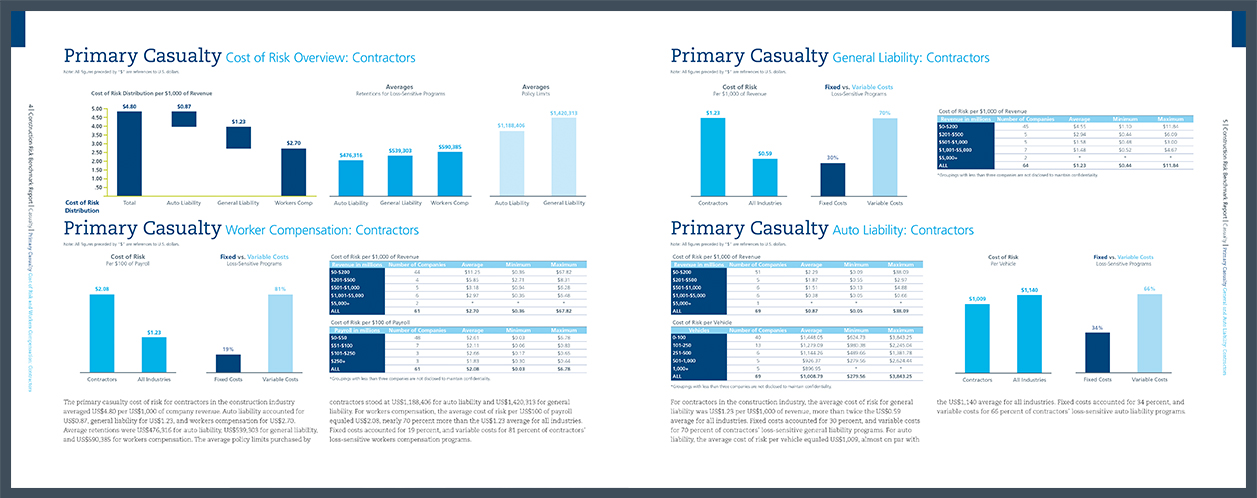
Marsh’s Industry Benchmark Reports, were a series of 9 annual reports covering key industries. The original reports were created in excel and outputted into PowerPoint creating a 40+ page document.
The task was to figure out a visual system to convey the necessary information and streamline the visual data to make the report more digestible for client meetings. After being immersed in data for 4 weeks, working closely with the benchmark leader, I came up with a new visual system combining charts and drilling past the unnecessary. This allowed us to create industry reports that told a concise story through a visual system that reduced page count by 50% to 75%. The first report was such a huge success with clients, the visual data system was locked down and retained solely for the use in the benchmark reports.